
Transforming complex systems
into executable operational understanding
the Minerva way
Minerva transforms complex physical, biological, operational, and quality systems into structured visual intelligence that helps organizations understand processes, align decisions, identify risks, and execute consistently across multidisciplinary environments.
Our visual-digital methodologies help development, manufacturing, quality, engineering, and regulatory teams convert fragmented information into operational knowledge that is easier to interpret, communicate, govern, and continuously improve.
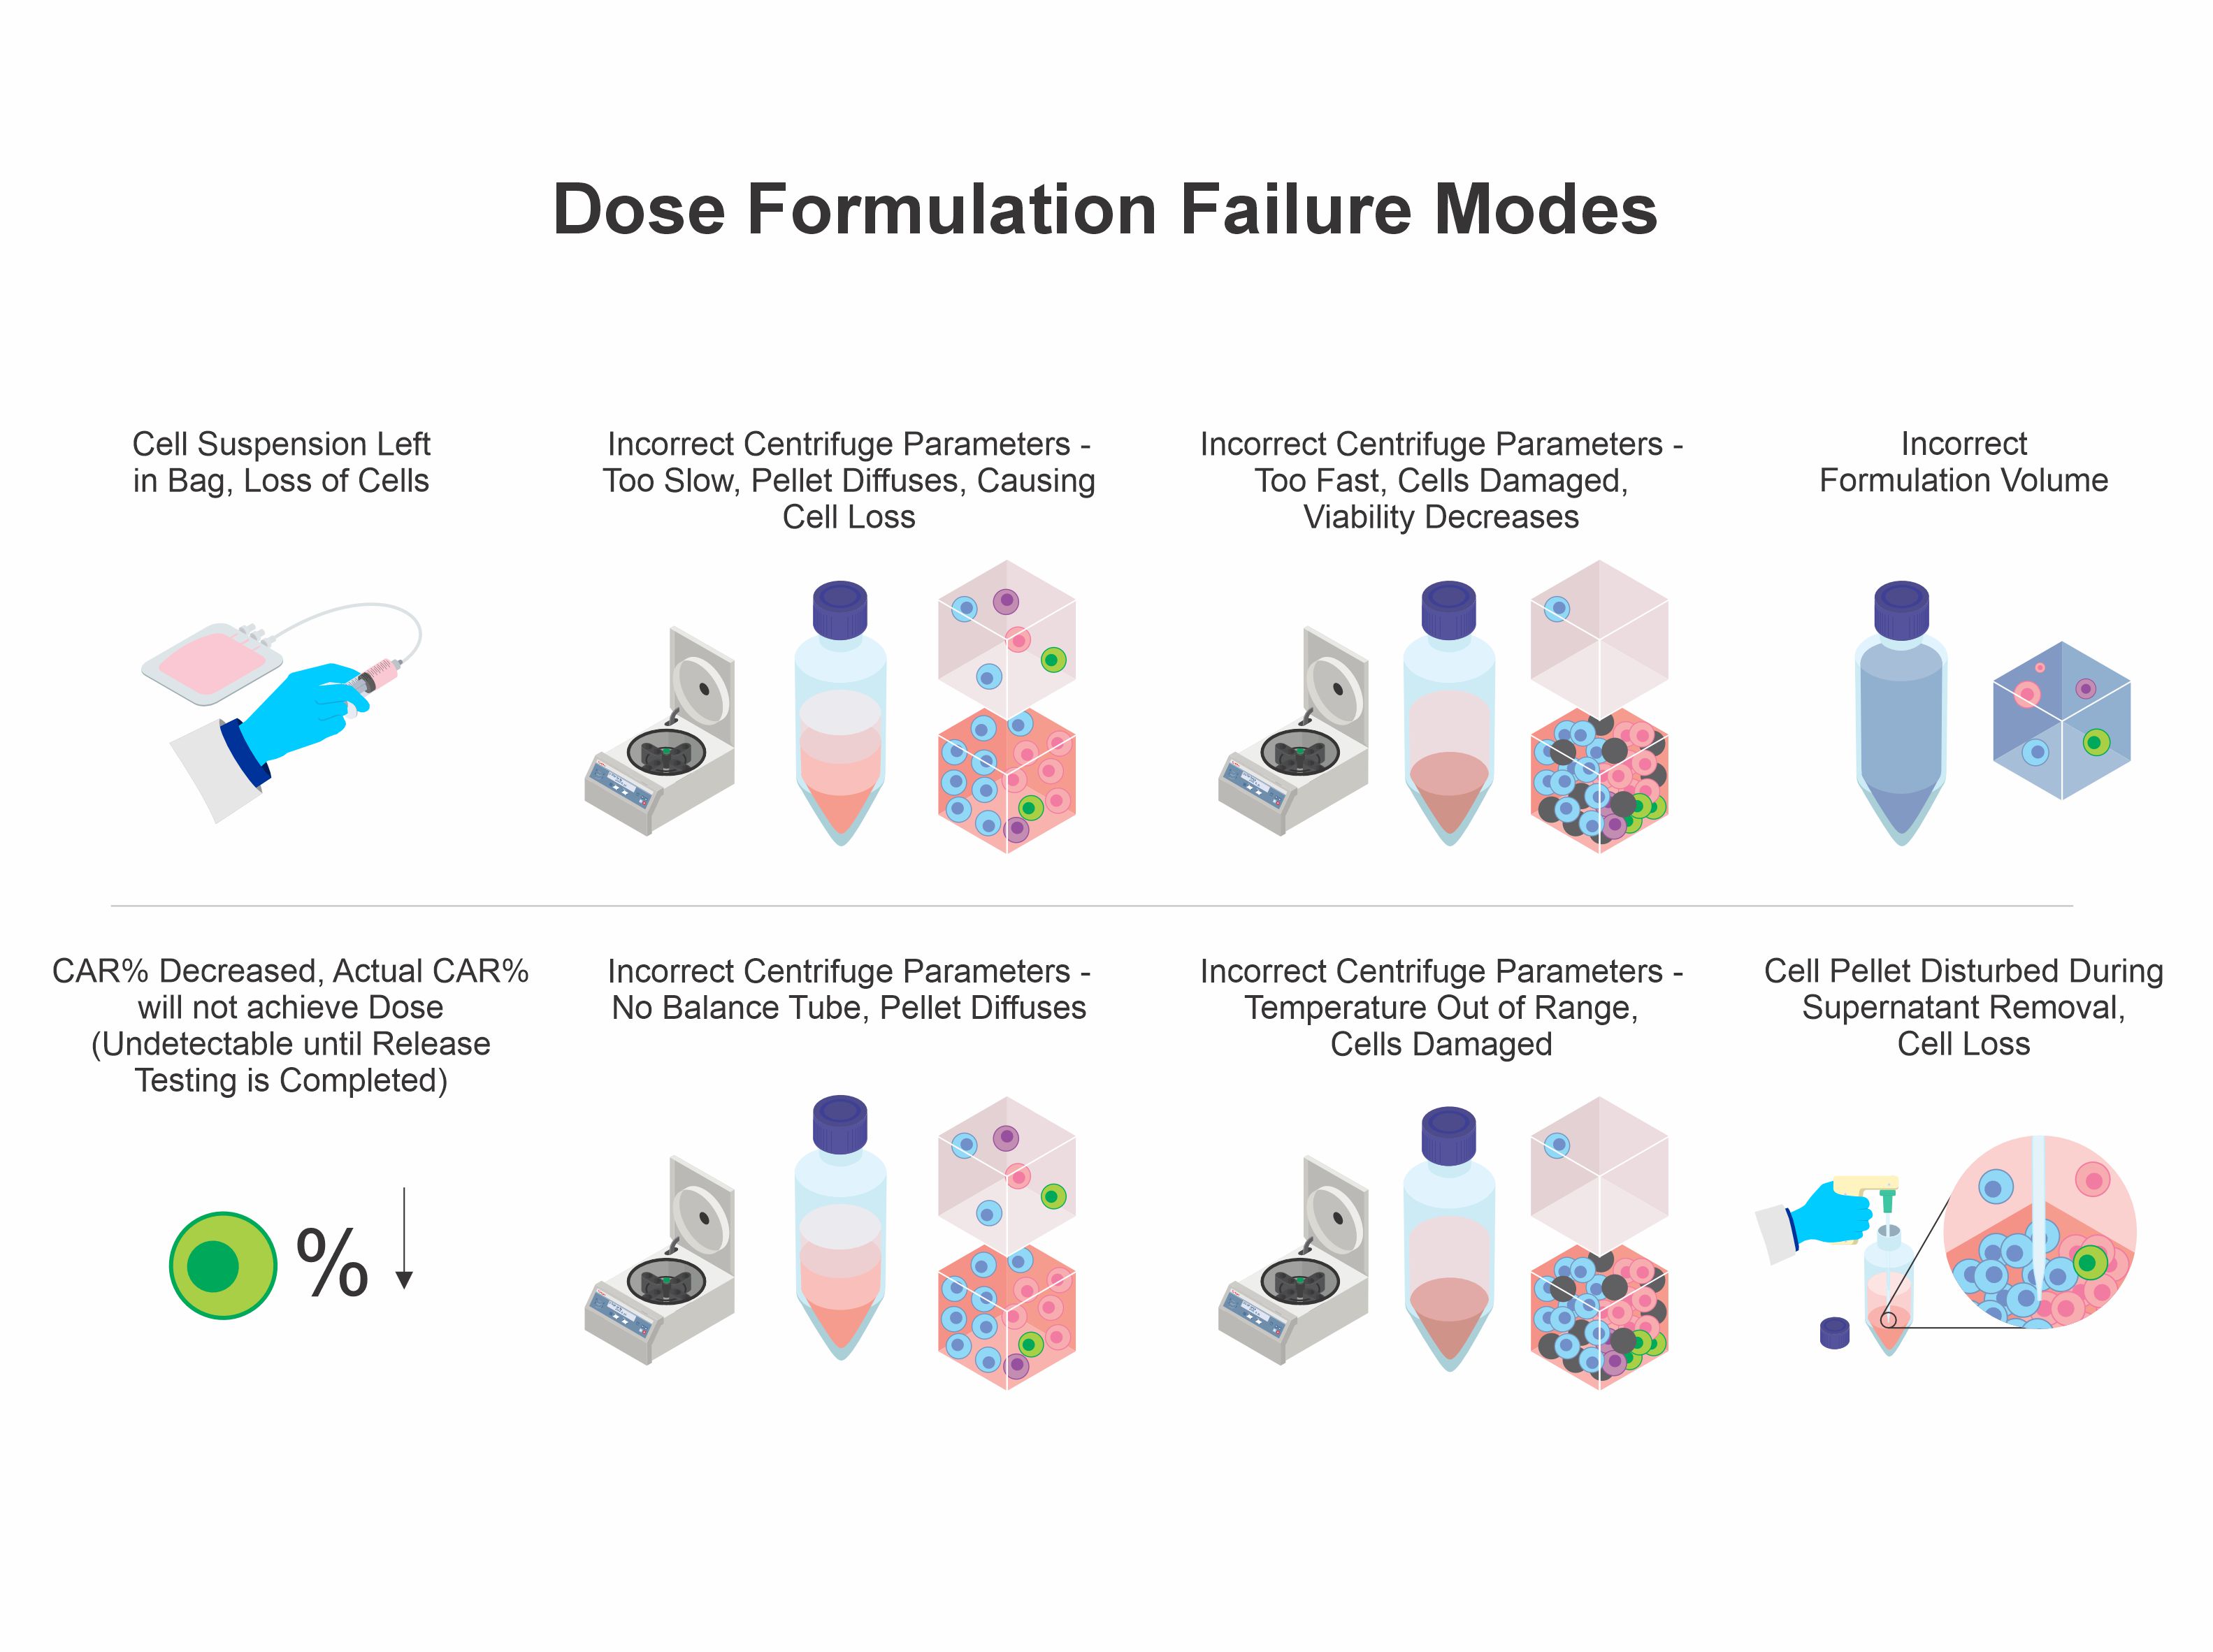
Minerva develops scientifically accurate visual representations of biological, chemical, manufacturing, and operational systems supported by concise, structured language designed for rapid interpretation and collaboration.
Our visualization methodologies are designed to evolve alongside processes, systems, and organizational knowledge, enabling continuous updates, operational consistency, and scalable communication across regulated environments.
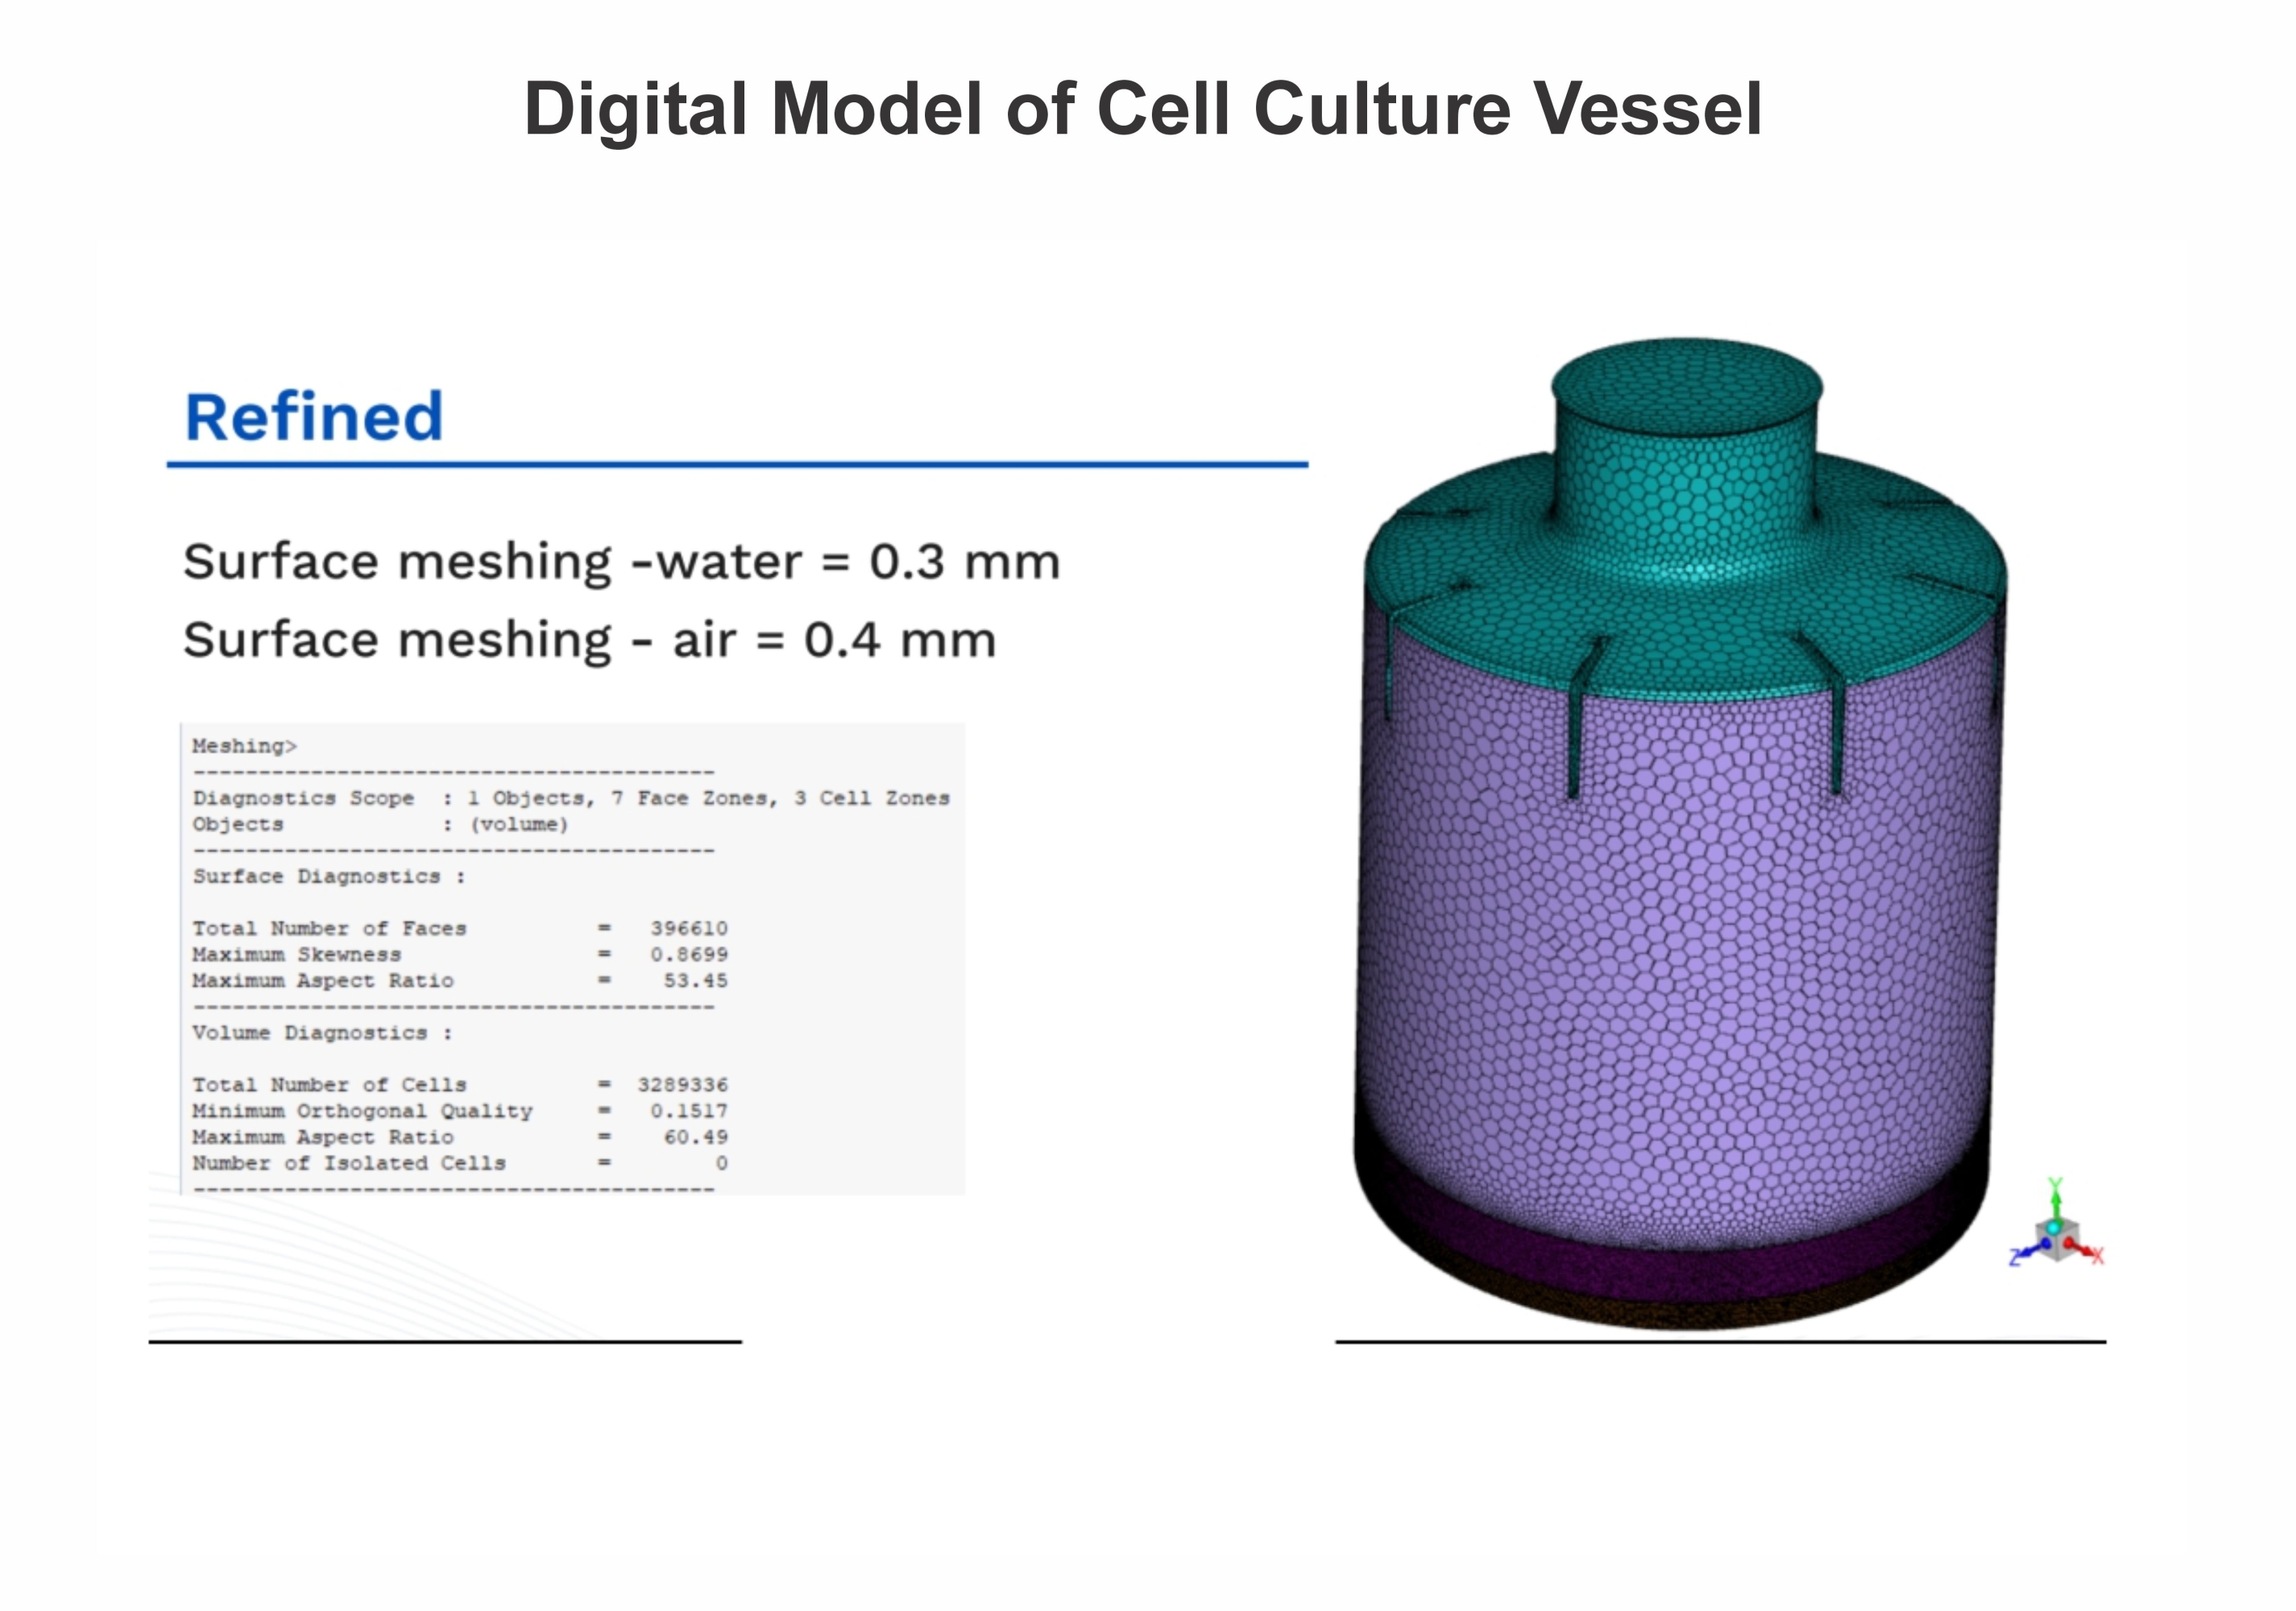
Gain deeper understanding of physical, biological, manufacturing, and operational systems through advanced visual and digital modeling approaches.
Minerva develops isometric representations, multivariable 3D system models, and dynamic operational simulations that help teams analyze interactions, process variability, material and personnel flow, and operational risks across facilities and global operations.
Minerva creates structured visual-digital models that support operational analysis, process optimization, knowledge management, and decision support across multidisciplinary organizations.
These structured representations enable collaboration between people, software platforms, analytics tools, AI systems, and future automation initiatives while preserving operational context and traceable system understanding.
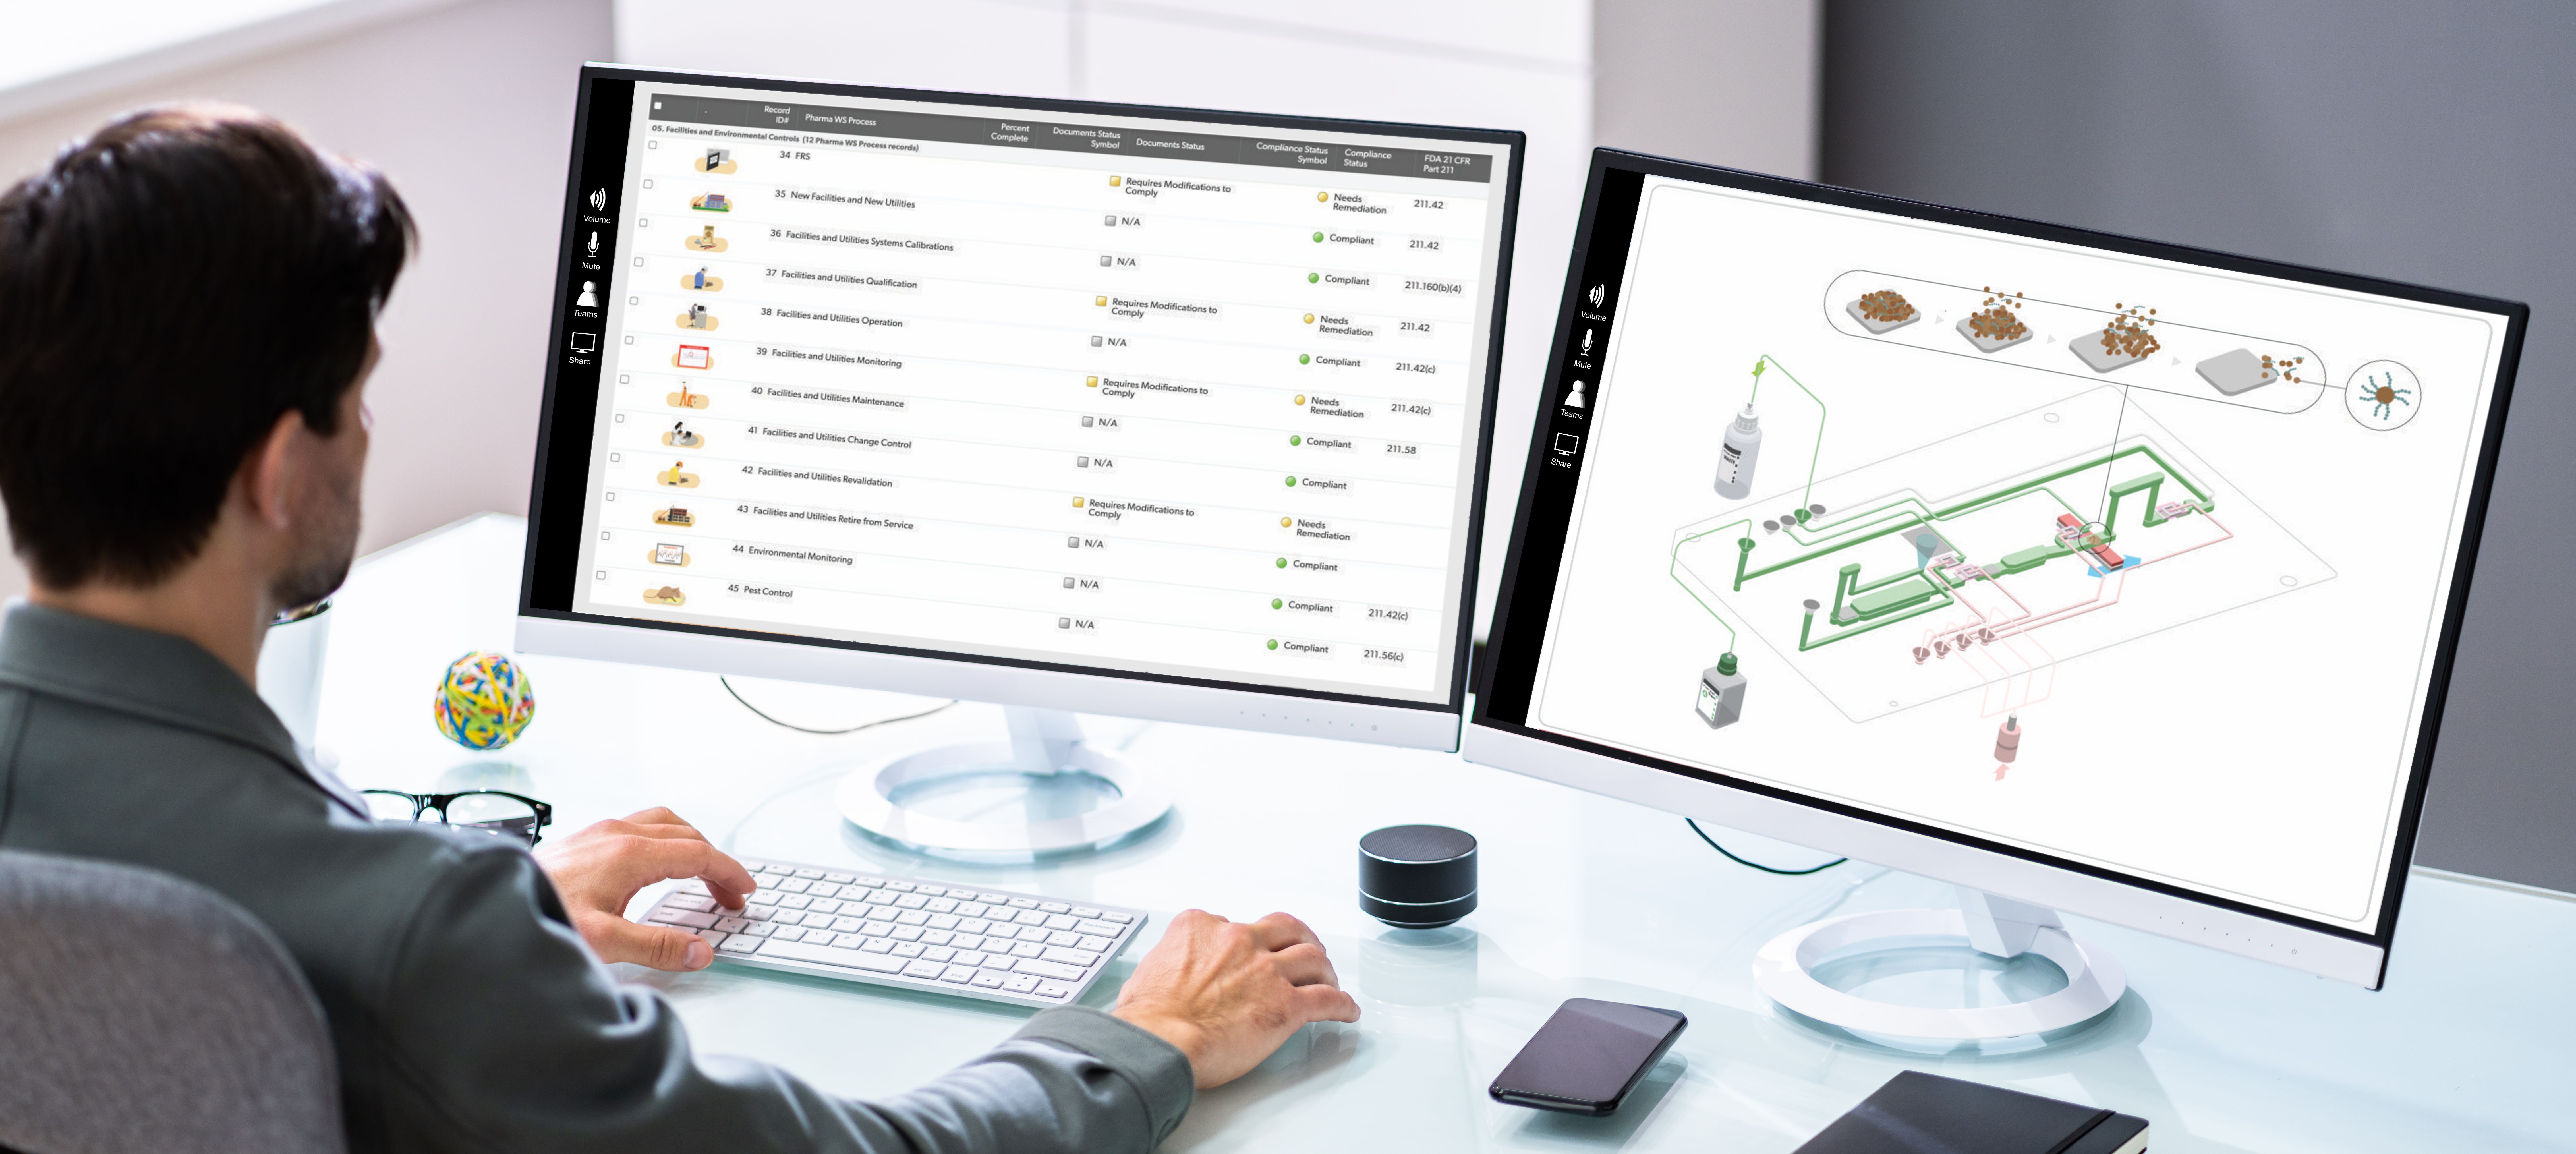
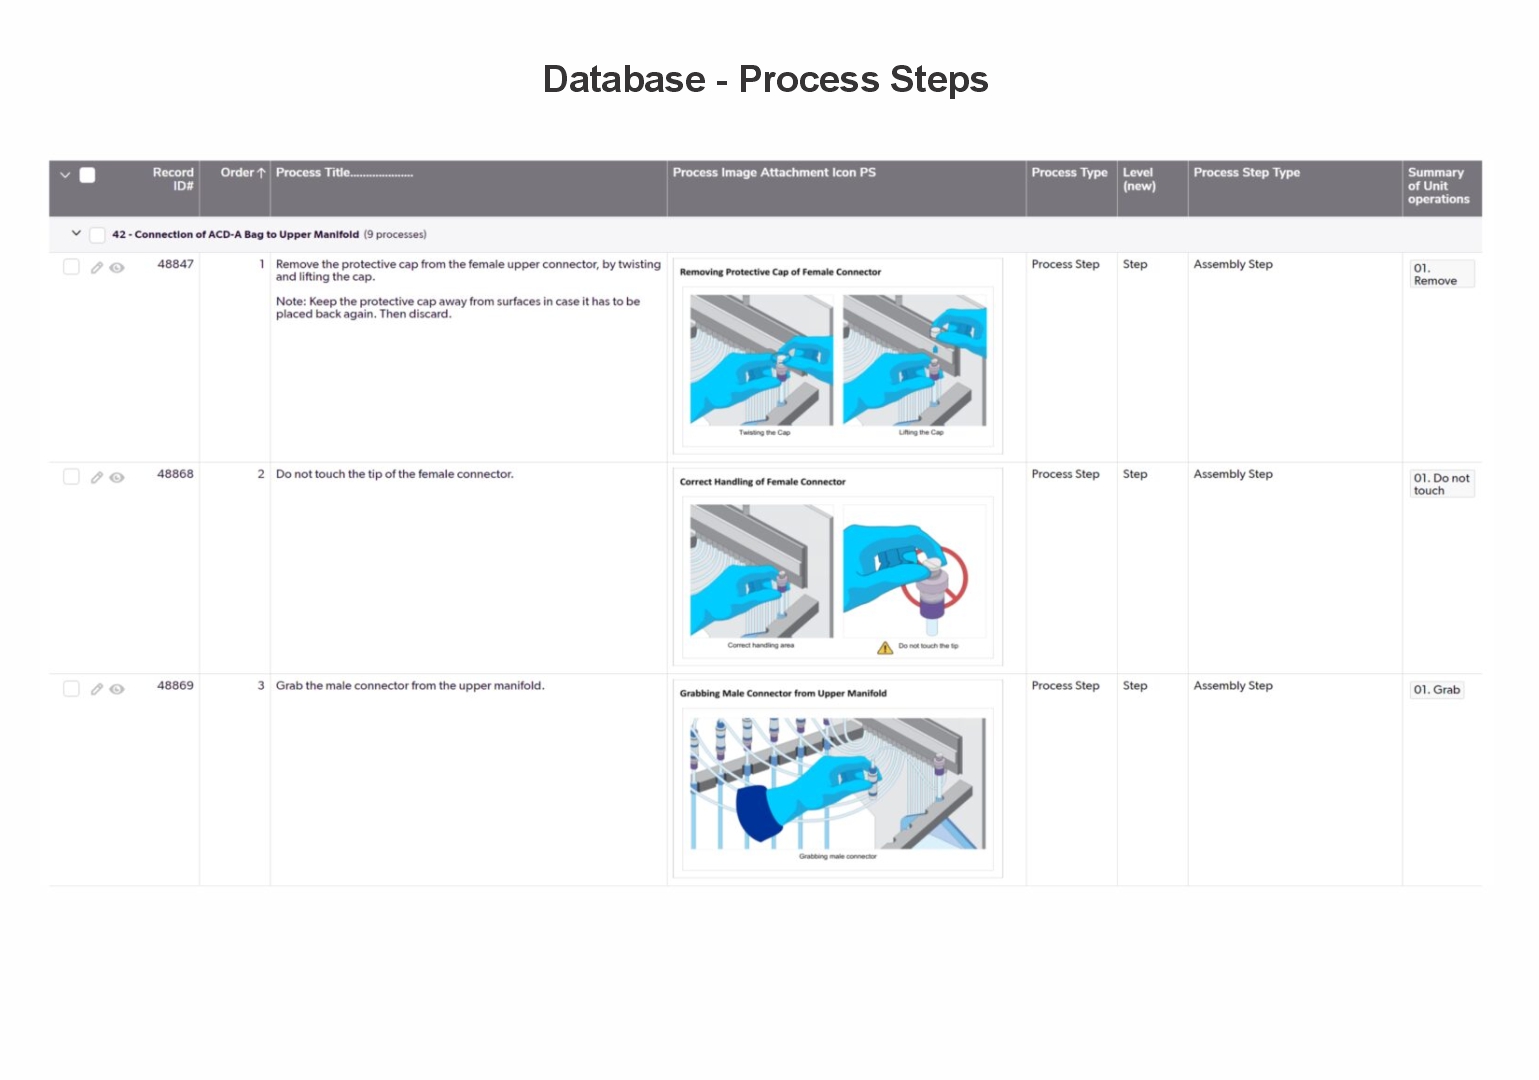
Minerva helps organizations prepare for AI-enabled operations by developing structured visual datasets that clearly represent operational conditions, workflows, relationships, and system behavior.
These visual-digital assets support both immediate human understanding and future use in analytics, machine learning, automation, and AI-assisted operational environments.
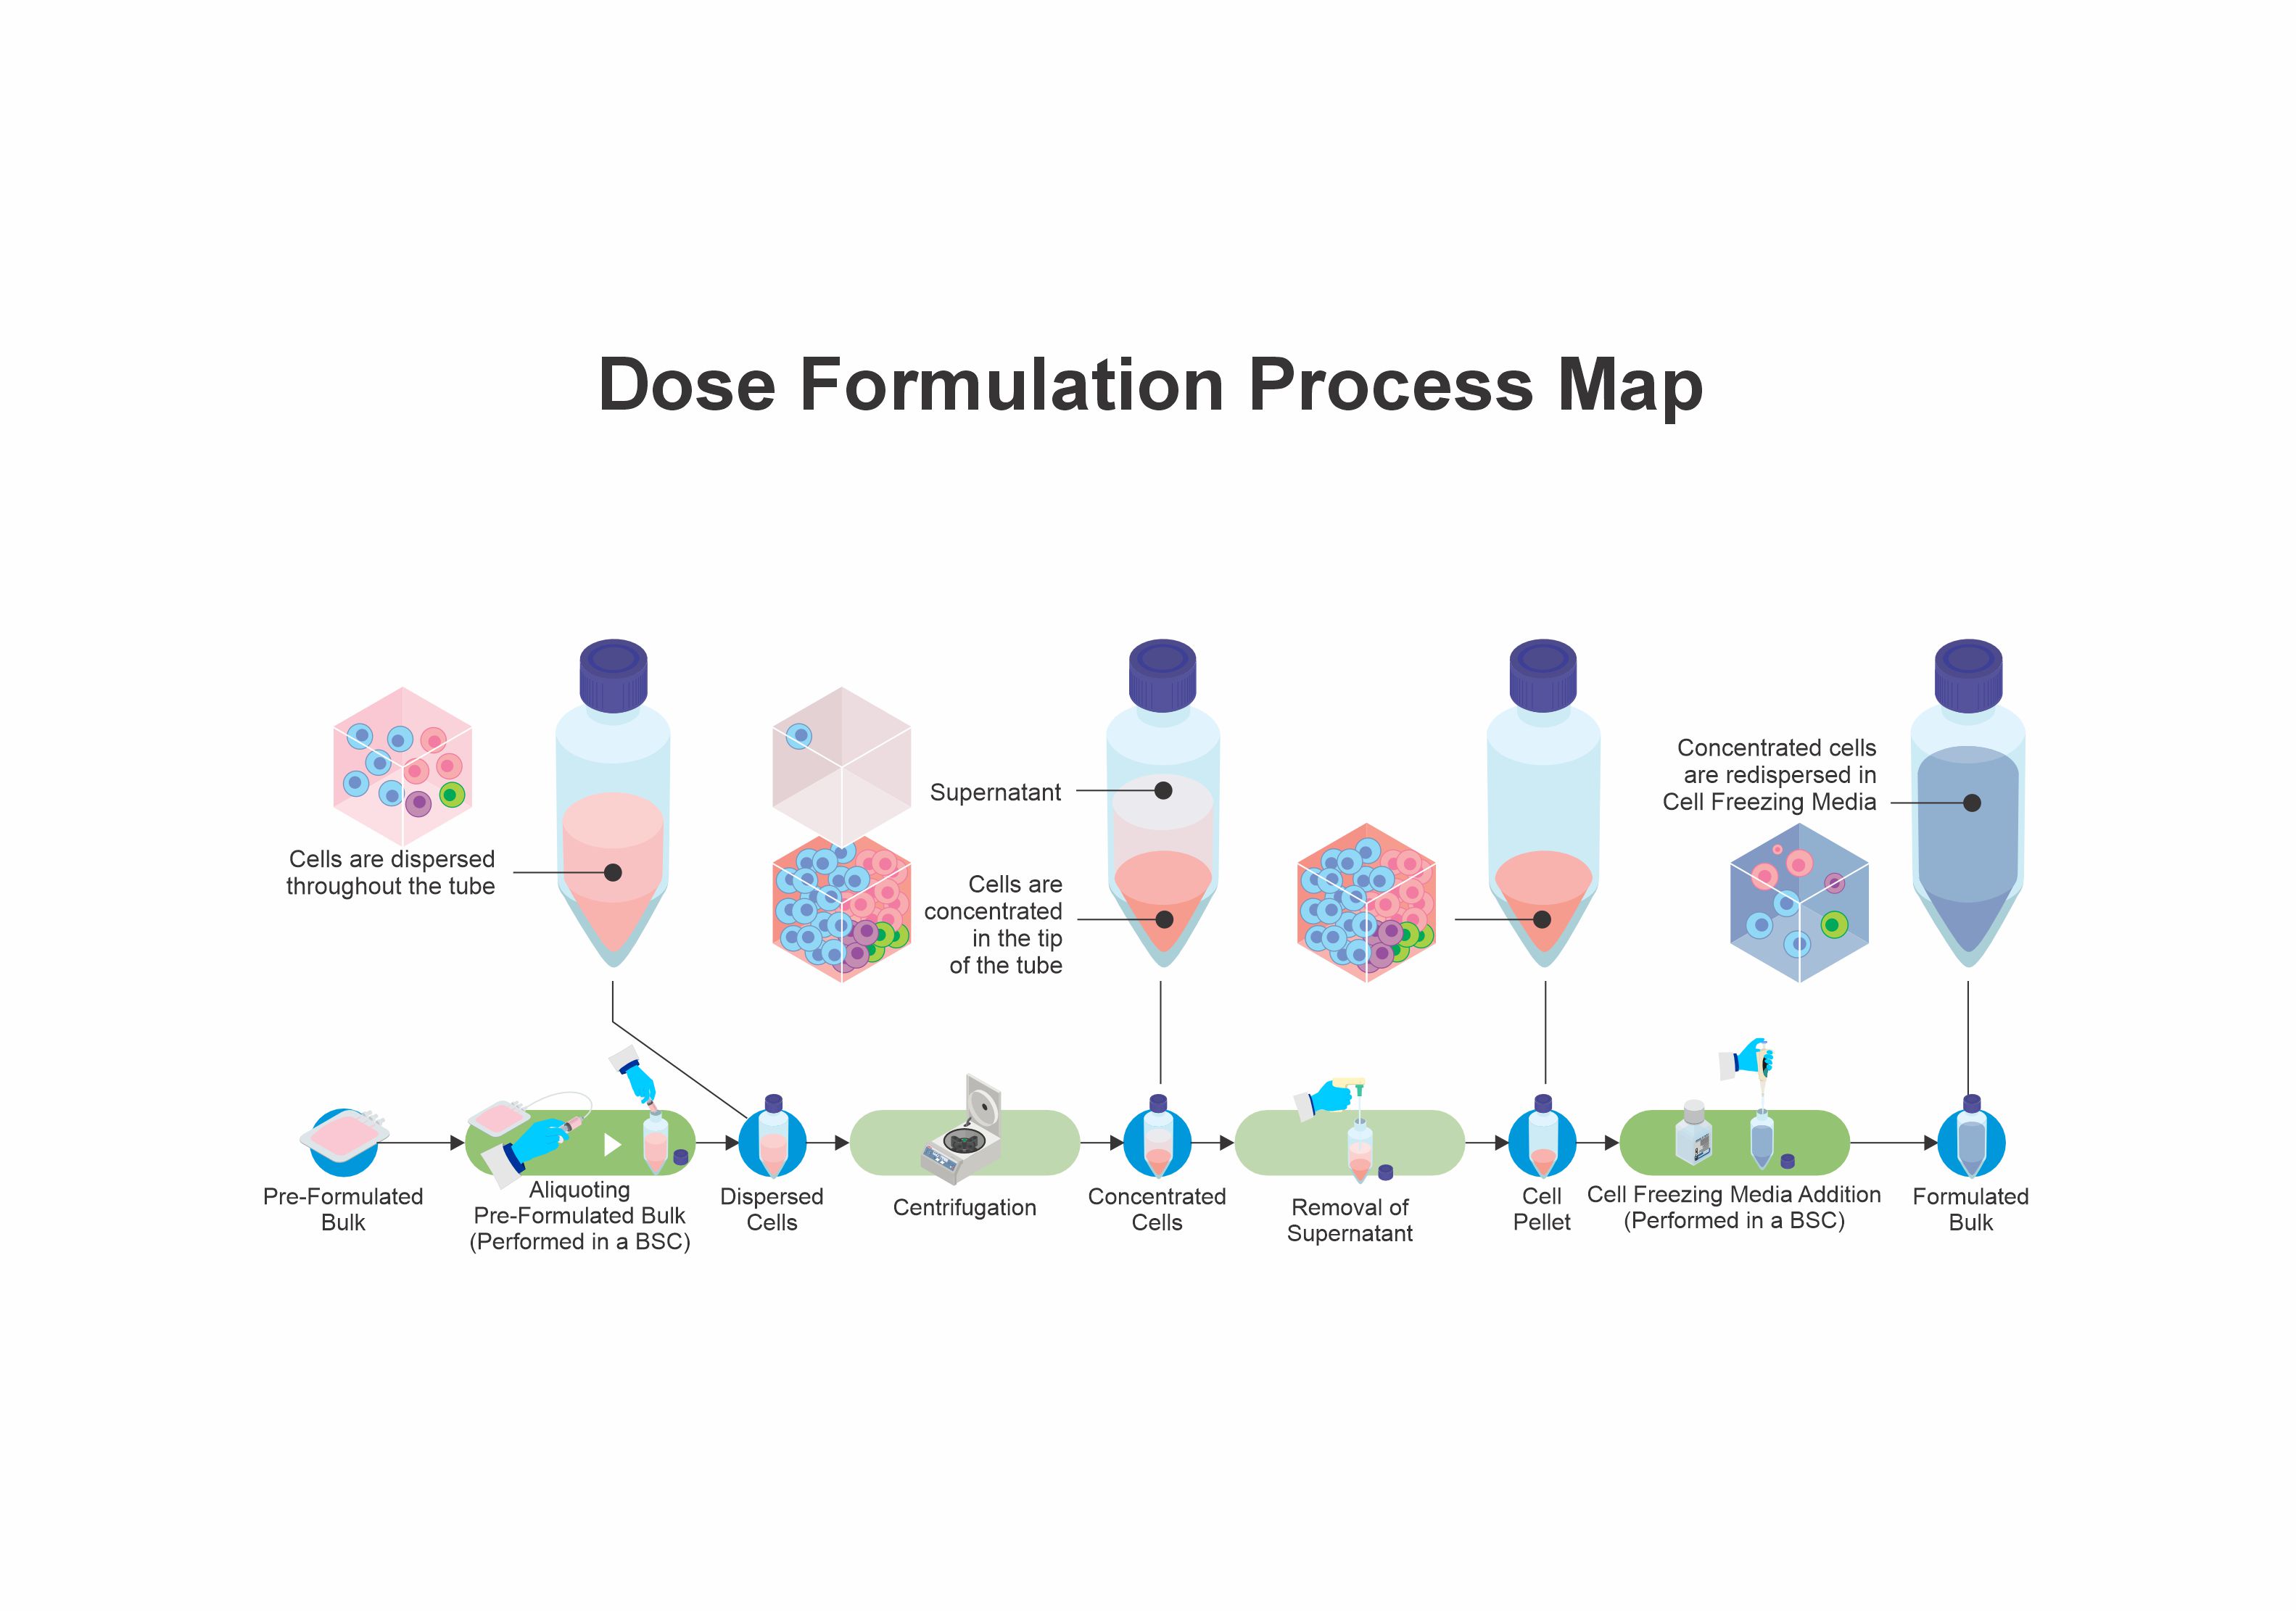
Our process maps combine standardized structure, intuitive visual flow, and Unified Modeling Language (UML) methodologies to create consistent operational understanding across teams, systems, and digital environments.
Minerva process architectures help organizations improve traceability, reduce interpretation variability, support governance initiatives, and strengthen operational alignment across complex workflows.
Minerva infographics combine scientific communication principles, structured information design, and visual storytelling to simplify complex relationships and accelerate multidisciplinary understanding.
These assets help organizations communicate critical concepts, operational insights, trends, and system interactions in ways that improve engagement, clarity, and knowledge retention.
Visual analysis is a core capability of the Minerva Way.
Minerva structures operational and quality data into tailored visual intelligence systems that help development, manufacturing, engineering, and quality teams identify trends, evaluate performance, monitor risks, and support faster data-informed decisions. Our visual analytics capabilities transform fragmented operational data into actionable organizational understanding.
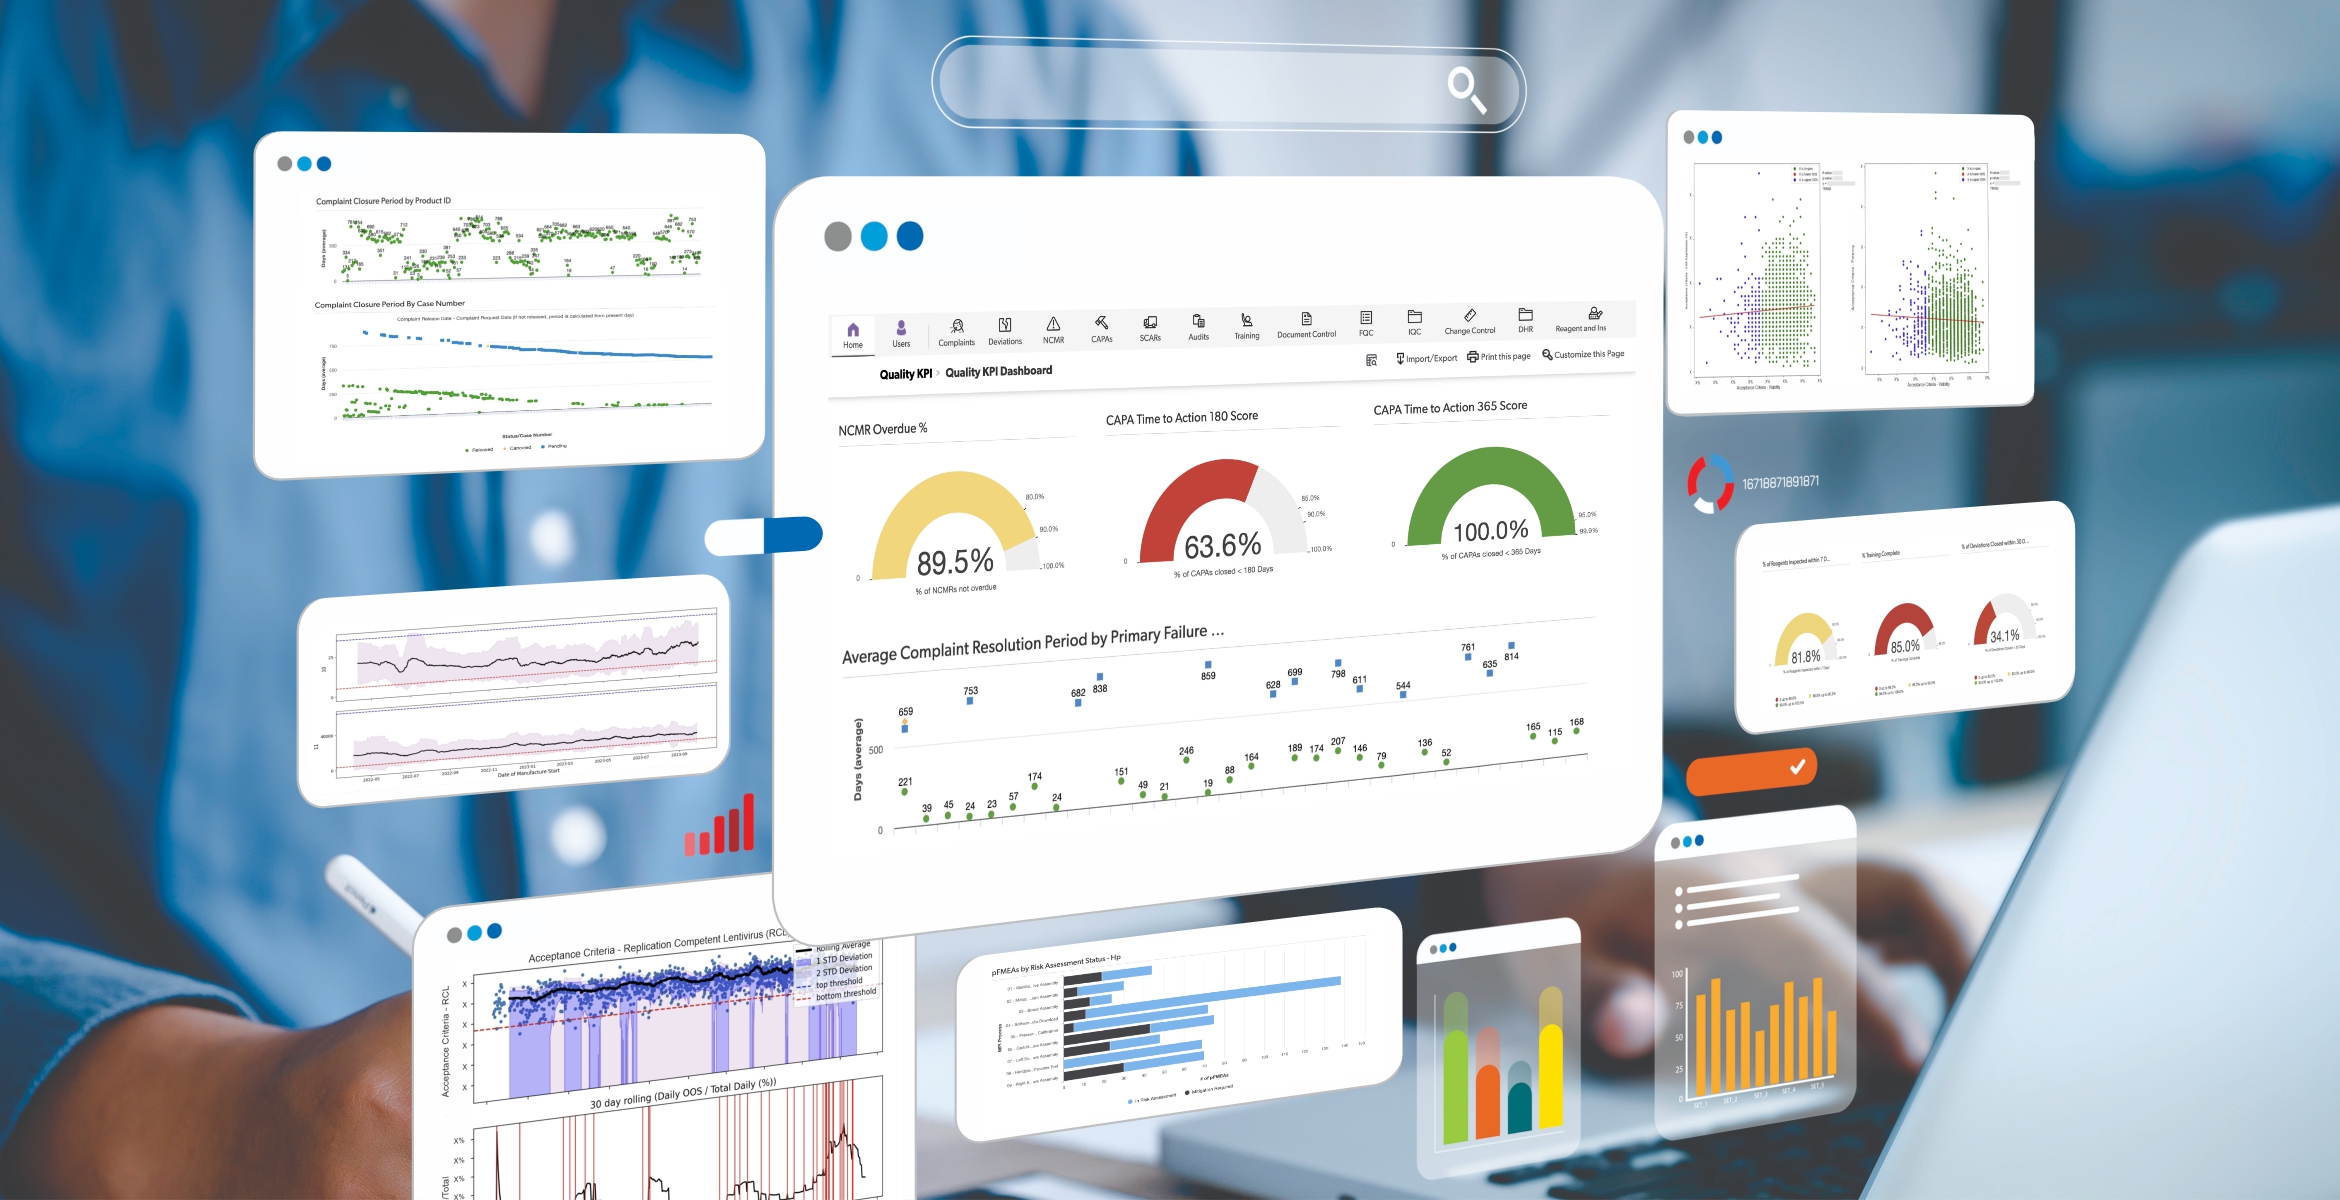
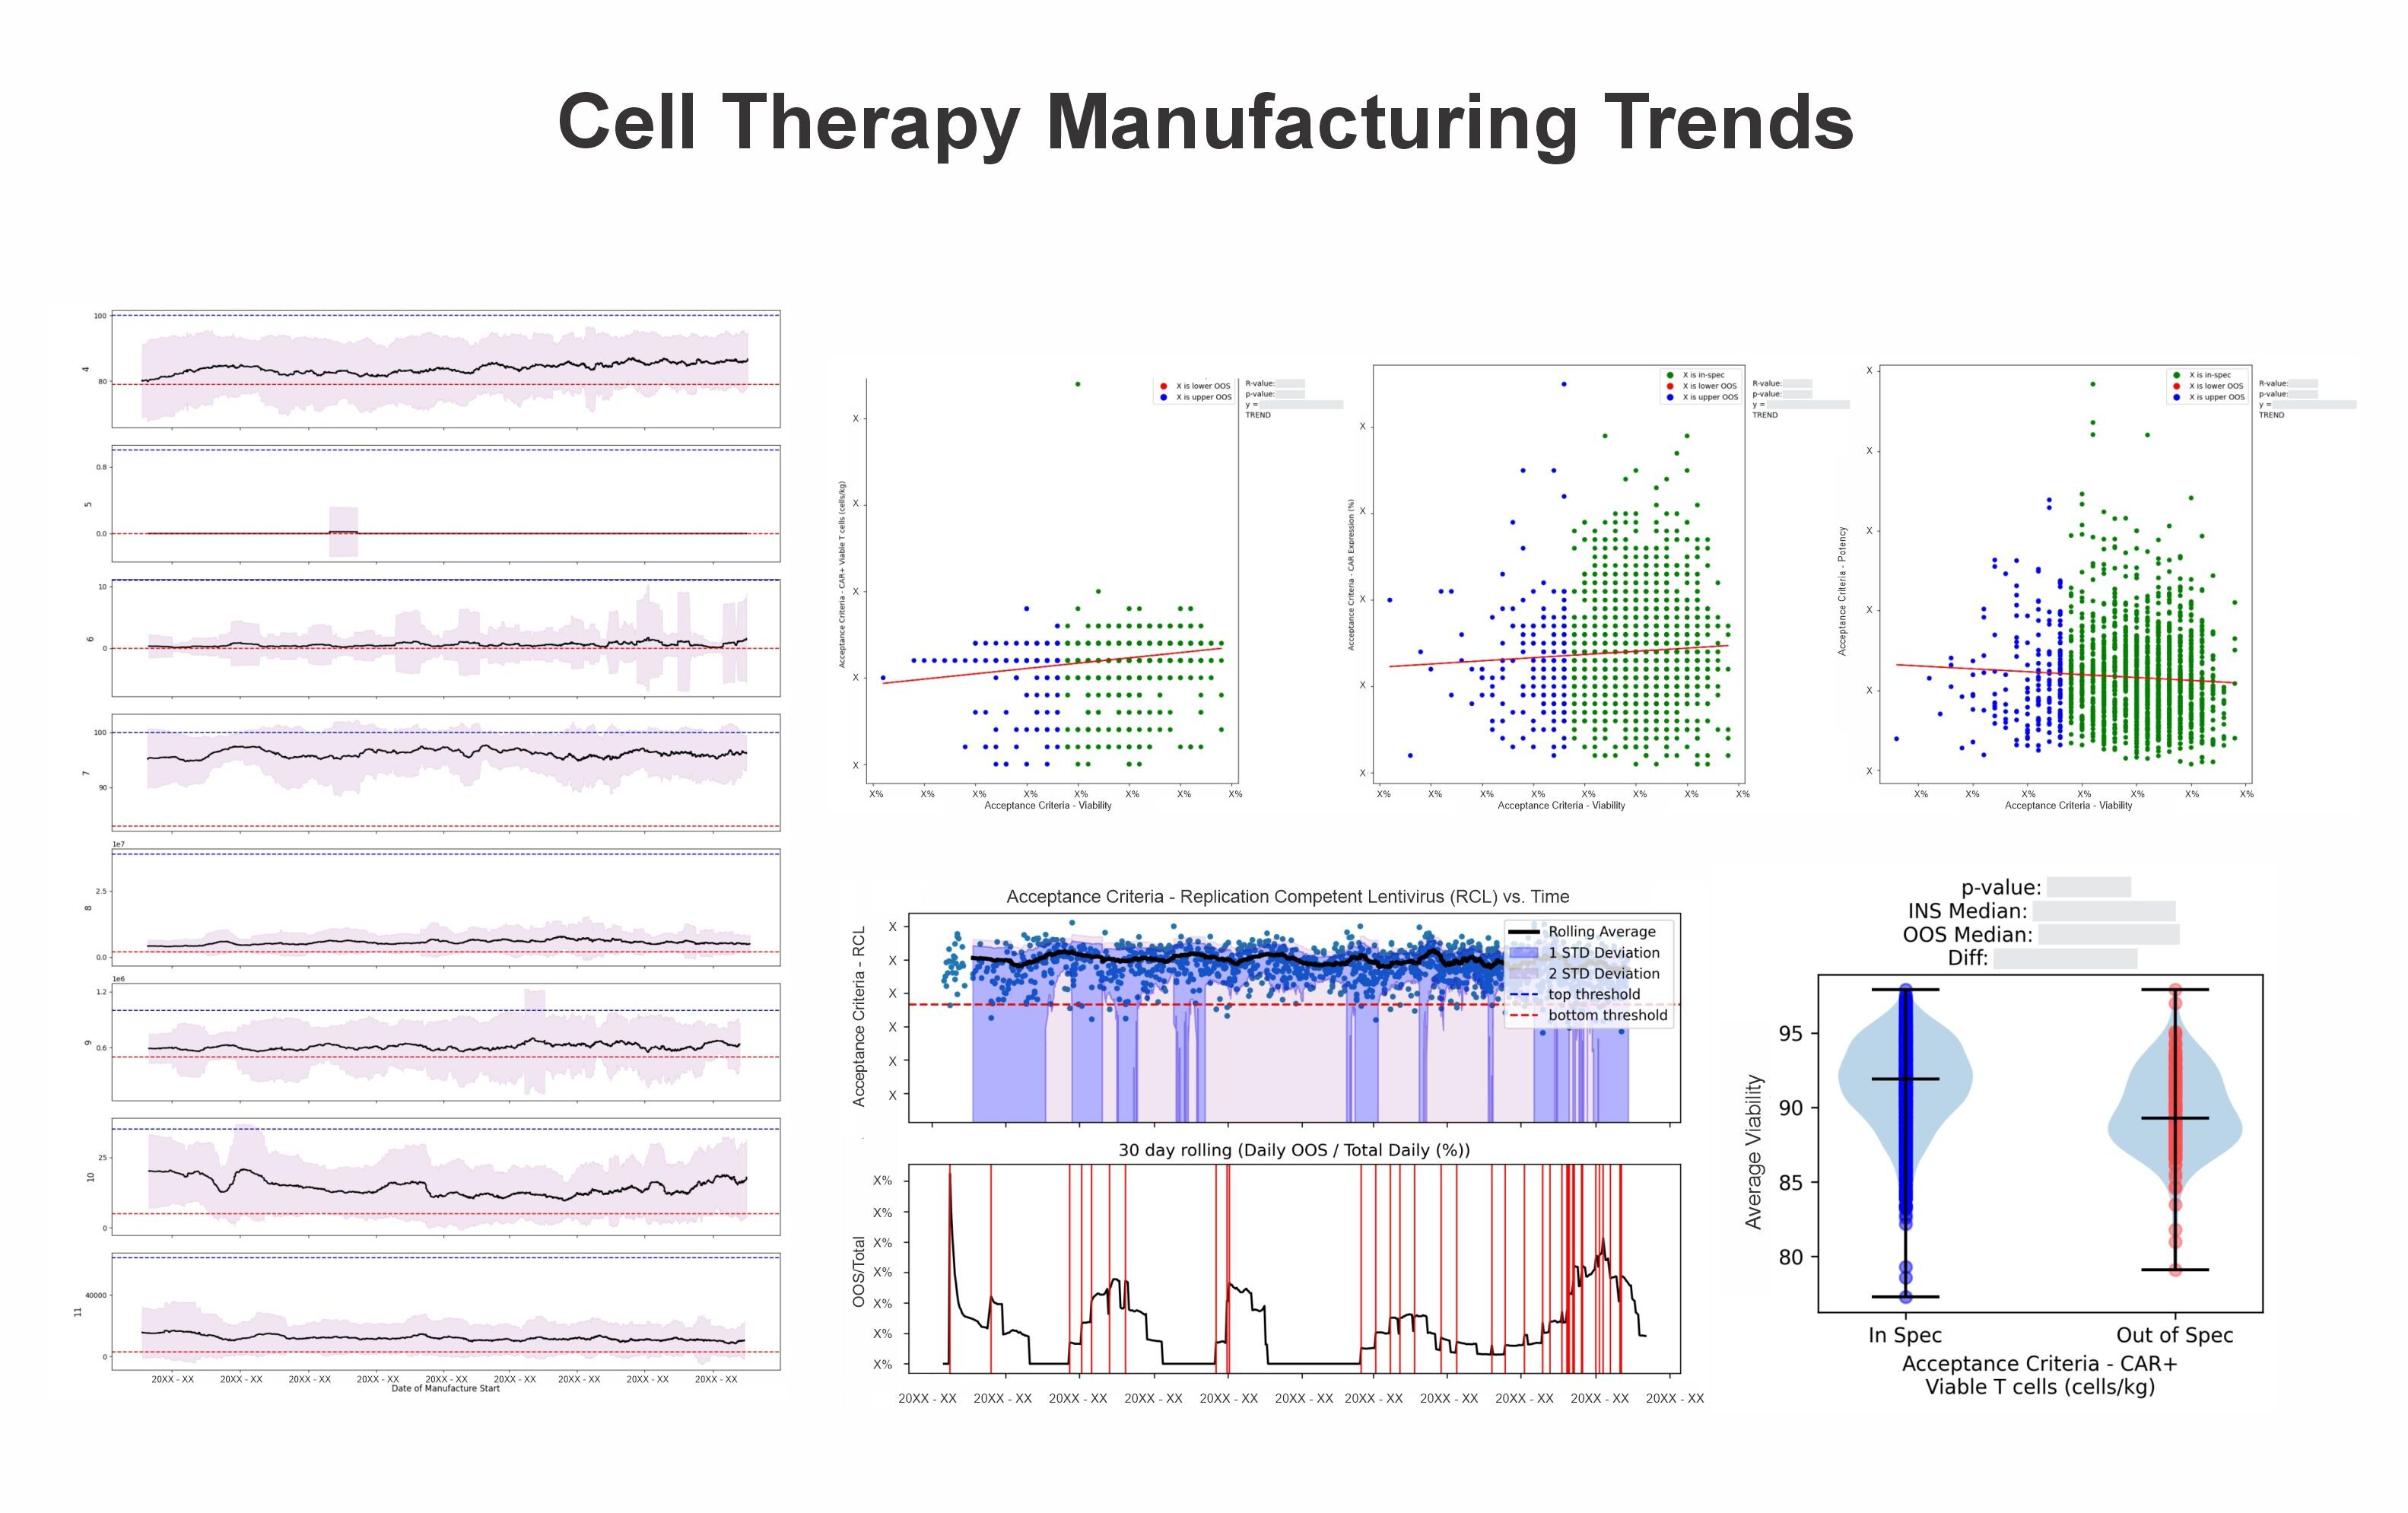
Our scientific and technical teams create analytical visual systems that transform experimental results, operational conditions, and systems data into understandable operational intelligence for faster interpretation, collaboration, and decision support.
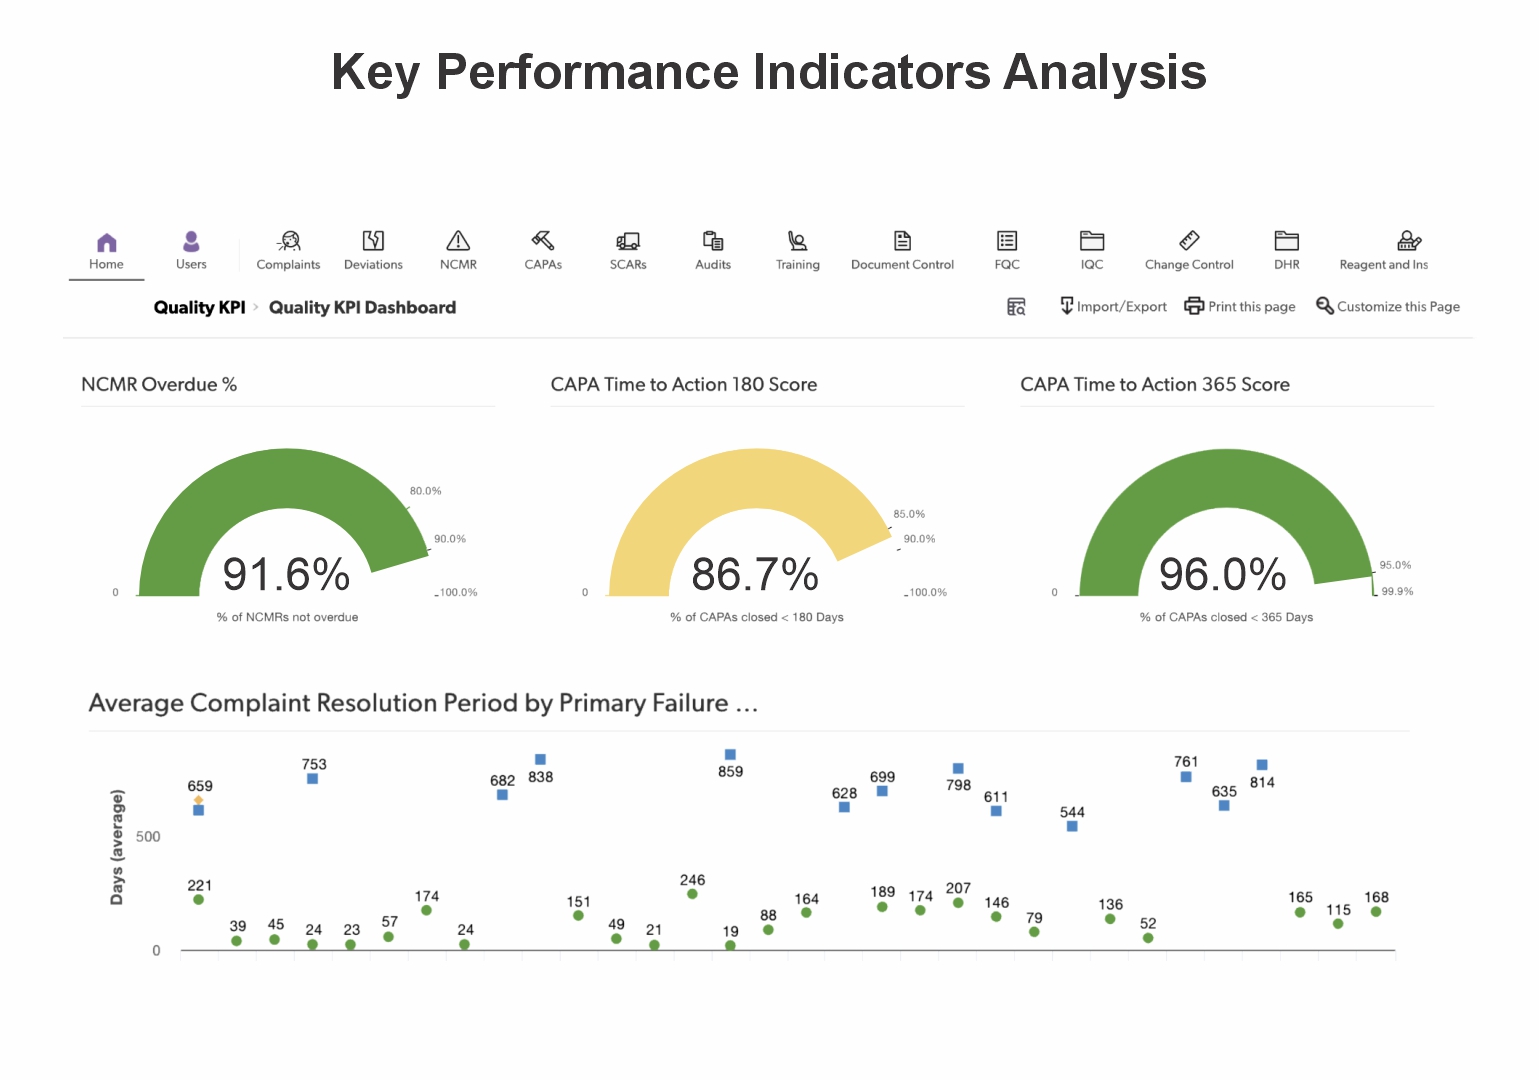
Minerva develops KPI dashboards and operational reporting systems that continuously structure and visualize manufacturing, quality, and business performance data for improved visibility and faster risk-informed decision-making.
These systems help organizations monitor performance, identify emerging issues, and strengthen operational awareness across sites and functions.
the Minerva way